In the digital age where cyberattacks are becoming increasingly sophisticated and severe, organizations face tremendous challenges in maintaining the security of their vast IT systems. One critical strategy that should never be overlooked is Patch Management - the systematic process of managing software patches that helps close security vulnerabilities before hackers can exploit your systems. Neglecting Patch Management can result in devastating consequences including data breaches, reputation damage, and immeasurable financial losses.
According to cyberattack statistics from 2024-2025, over 60% of successful attacks exploited vulnerabilities that already had patches released, but organizations had not yet updated their systems. This demonstrates the critical importance of having effective and up-to-date Patch Management practices in place.

Why Patch Management Is Critical Right Now
As cybersecurity experts at KTNBS, we have witnessed numerous case studies where organizations suffered from attacks due to inadequate Patch Management systems. Managing patches isn't just about clicking the "Update" button - it's a systematic process that requires planning, testing, and continuous monitoring.
Security vulnerabilities arise from various causes, including coding errors, incomplete system designs, or the discovery of new attack methods. Software developers create patches to fix these vulnerabilities, but without an effective Patch Management process, these patches remain unused and vulnerabilities stay open.
Risks of Poor Patch Management
- Ransomware Attacks: Hackers frequently exploit unpatched vulnerabilities as entry points to encrypt data and demand ransom payments
- Data Breaches: System vulnerabilities can be exploited to steal critical organizational and customer data
- System Downtime: Certain vulnerabilities can cause systems to malfunction or completely shut down
- Reputation Damage: When successful attacks occur, organizations lose trust from customers and partners
- Remediation Costs: Post-incident remediation costs are exponentially higher than prevention
For more detailed information about current cybersecurity threats, you can read our Cybersecurity Trends 2025 article, which will help you understand the overall risk landscape organizations are facing.
Key Components of Effective Patch Management Systems
A good Patch Management system must consist of multiple components working together. It's not just about downloading and installing patches, but requires systematic planning and execution as follows:
1. Assessment and Prioritization
Not all patches carry equal importance. Effective Patch Management must be able to assess vulnerability severity and potential impact on organizational systems. Factors to consider include:
- CVSS Score: Standard score measuring vulnerability severity (0-10)
- Exploitability: Whether exploit tools are publicly available
- Asset Criticality: How critical the system to be patched is to business operations
- Exposure: Whether the system is exposed to the internet or internal network only
At KTNBS, we use a holistic risk scoring system that considers all these factors to ensure high-priority patches are installed first within appropriate timeframes.
2. Testing
Installing patches directly in production systems without testing can cause more harm than the original vulnerability. A good Patch Management process must include testing in an environment similar to the actual system (Staging Environment) to verify that:
- Patches can be installed successfully
- They don't impact existing system functionality
- They don't conflict with other installed software
- System performance remains at acceptable levels
For organizations with critical systems requiring 24/7 operation, we recommend thorough testing with clear rollback plans in case problems occur, aligning with our IT Infrastructure Management services that prioritize business continuity.
3. Deployment Planning
After testing, implementing Patch Management in production requires careful planning, considering:
- Maintenance Window: Optimal time for patch installation without impacting usage
- Phased Rollout: Staged installation starting with test groups before organization-wide deployment
- Communication: Advance notification to users
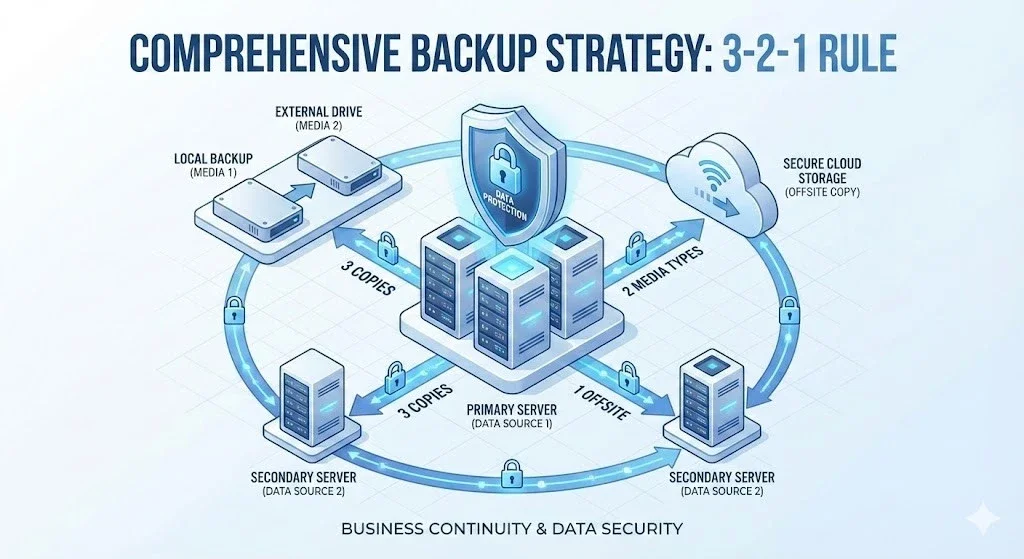
- Backup Strategy: Data backup before patch installation
4. Monitoring and Reporting
Patch Management doesn't end at installation completion but requires continuous monitoring to verify:
- Whether patches installed successfully on all devices
- Which devices haven't received patches (Compliance Rate)
- Whether post-installation issues occurred
- Average patch installation time (Mean Time to Patch)
A good reporting system helps IT managers assess process efficiency and make continuous improvements.
Common Patch Management Challenges Organizations Face
Despite understanding the importance of Patch Management, many organizations still struggle with effective implementation. Common challenges include:
1. Lack of Resources and Personnel
Many organizational IT teams have such heavy workloads that they don't have time for systematic Patch Management. Patch installation becomes a task done only when time permits, which is insufficient against continuously emerging threats.
2. Diverse and Complex Systems
Modern organizations typically have diverse IT systems, from Windows and Linux servers, network devices, cloud systems, to IoT devices. Managing patches for each platform requires different tools and expertise.
3. Legacy Systems Not Supporting Patches
Some older systems may no longer receive patch releases, or patch installation might cause system malfunctions. This forces organizations to either accept risks or find alternative protection methods.
4. Fear of Downtime
Many organizations hesitate to install patches due to concerns about system downtime, especially for systems requiring 24/7 operation. However, delaying patch installation continuously increases risk.
At KTNBS, we understand these challenges and offer Patch Management as a Managed Service solution that helps lighten the burden on your IT team, from risk assessment and patch testing to installation and monitoring.
Best Practices for Successful Patch Management
From our experience managing IT systems for over 26 clients at KTNBS, we've compiled best practices for effective Patch Management:
1. Create Clear Patch Management Policy
Organizations must have clearly defined policies specifying:
- Which patch types must be installed within how many days (e.g., Critical = 7 days, High = 30 days)
- Who is responsible for each step
- Approval process for critical systems
- Testing standards that must be passed before installation
2. Use Appropriate Tools
Manual Patch Management for large organizations is impractical. Automation tools are necessary, such as:
- Microsoft WSUS/SCCM for Windows
- Red Hat Satellite for Linux
- Third-party tools like ManageEngine, Ivanti, SolarWinds
- Cloud-based solutions for organizations using hybrid environments
These tools enable overview visibility of patches requiring installation, automated scheduling, and efficient reporting capabilities.
3. Create Proper Testing Environments
Investing in good testing systems reduces risks from problematic patches. You should have:
- Test environments similar to production
- Automated testing suites
- Tested rollback procedures
4. Maintain Comprehensive Asset Inventory
You cannot perform Patch Management effectively without knowing what devices exist in your system. You must maintain an always-updated asset database including:
- Hardware and software installed on each machine
- Software versions and already-installed patches
- Responsible parties and criticality of each system
- Dependencies between various systems
Having good asset inventory helps ensure Patch Management accuracy and covers all organizational systems.
5. Communicate Regularly with Stakeholders
Patch management isn't solely the IT team's responsibility. Communication is needed with:
- Executives: Regular status and risk reporting
- Business Owners: Coordination on maintenance windows
- End Users: Advance notification of patches that may impact usage
- Security Team: Exchange information about new threats and vulnerabilities
6. Conduct Regular Vulnerability Scanning
Besides tracking patches from vendors, regular system vulnerability scanning should be performed to discover potentially overlooked weaknesses. Vulnerability scanner tools help examine systems and report discovered vulnerabilities with remediation recommendations.
KTNBS's Cybersecurity team provides Vulnerability Assessment and Penetration Testing services to help organizations discover and fix vulnerabilities before they can be exploited.
Case Study: Patch Management Success in Manufacturing Organization
One of our manufacturing sector clients experienced a ransomware attack exploiting the EternalBlue vulnerability, which had a patch released over 6 months prior but remained uninstalled on multiple systems. This resulted in a 3-day production line shutdown and losses exceeding $1.5 million.
Subsequently, we helped design and implement a comprehensive Patch Management system for this organization, consisting of:
- WSUS system installation for managing Windows Server and Workstation patches
- Development of Patch Management Policy defining installation timeframes by severity level
- Creation of test environment for patch testing before production deployment
- Installation of vulnerability scanner system with automated weekly scans
- Development of real-time patch status reporting dashboard
Results after 1 year of operation:
- Patch Compliance Rate increased from 45% to 98%
- Mean Time to Patch for Critical Vulnerabilities reduced from 45 days to 5 days
- No security incidents related to unpatched vulnerabilities
- 80% reduction in downtime from security issue remediation
This example demonstrates that effective Patch Management can genuinely prevent serious damage.
New Technologies and Trends in Patch Management
The world of Patch Management continues to evolve with interesting new technologies and concepts:
1. AI/ML-Powered Patch Management
Using artificial intelligence to analyze and prioritize patches by considering multiple factors simultaneously, including predicting potential risks from individual vulnerabilities.
2. Zero-Touch Patching
Automated patch installation without human intervention. Systems test, install, and verify results entirely automatically.
3. Container and Microservices Patching
Patch management for modern platforms like Kubernetes and Docker that are complex and require different approaches from traditional systems.
4. Cloud-Native Patch Management
Tools specifically designed for cloud and hybrid cloud environments that can manage patches for both on-premise and cloud workloads from a single point.
5. Virtual Patching
For systems that cannot install patches, virtual patching techniques are used by configuring WAF (Web Application Firewall) or IPS (Intrusion Prevention System) to prevent attacks through those vulnerabilities instead.
Patch Management and Compliance Standards
Effective Patch Management isn't just about security but also required by various standards and regulations, such as:
- ISO 27001: Requires systematic technical vulnerability management
- PCI DSS: Requires critical patch installation within 1 month
- GDPR/PDPA: Neglecting Patch Management may constitute inadequate personal data protection
- NIST Cybersecurity Framework: Contains vulnerability management requirements
Organizations requiring compliance audits for these standards must demonstrate evidence of effective Patch Management processes with audit trails.
KTNBS has experience helping organizations prepare for various standard audits, including necessary documentation and evidence preparation. Details available at our Compliance & Security Audit services.
Costs and ROI of Patch Management
Many organizations view Patch Management investment as expensive, but compared to potential costs from attacks, this investment proves highly valuable.
Potential Costs from Poor Patch Management
- Downtime: System downtime can lose millions per hour in revenue
- Data Breach: GDPR/PDPA fines can reach millions of dollars
- Ransomware: Ransom payments and system recovery costs
- Loss of Reputation: Customer trust erosion
- Legal Costs: Legal expenses and lawsuits
Investment in Patch Management
- Software and Tools: $3,000 - $15,000/year depending on organization size
- Personnel: Managed services are more cost-effective than full-time staff
- Infrastructure: Test environments and backup systems
- Training: Team training programs
ROI from good Patch Management typically shows results within 6-12 months, measured by reduced security incidents and system downtime.
Getting Started with Patch Management in Your Organization
If your organization lacks an effective Patch Management system, here are recommended steps to begin:
Step 1: Assess Current State
- Inventory all assets
- Check which patches remain uninstalled
- Identify high-risk systems
- Evaluate current IT team capabilities
Step 2: Define Policies and Procedures
- Create clear Patch Management policies
- Define installation timeframes by severity
- Specify responsibilities for each step
- Develop rollback plans
Step 3: Select Appropriate Tools
- Consider organization size and complexity
- Evaluate available budget
- Trial multiple tools
- Consider managed services if lacking resources
Step 4: Pilot Implementation
- Start with small system groups first
- Test entire process
- Improve based on feedback
- Expand to other systems
Step 5: Continuous Improvement
- Track KPIs and metrics
- Review and improve processes regularly
- Update with new technologies
- Provide ongoing team training
Conclusion: Patch Management - Prevention Is Worth More Than Cure
In an era where cyber threats are increasingly sophisticated and severe, having an effective Patch Management system isn't optional but essential. Preventing vulnerabilities before attacks is the most cost-effective approach in both time and budget.
A good Patch Management system must include risk assessment, thorough testing, appropriate deployment planning, and continuous monitoring. It requires suitable tools, capable personnel, and clear processes.
At KTNBS, we have over 10 years of experience managing IT systems and cybersecurity for leading organizations in Thailand. We offer comprehensive Patch Management services, from current state assessment, system design, tool installation, to continuous maintenance.
Don't wait for unexpected incidents. Start building a robust Patch Management system for your organization today, because prevention is better than cure, and security investment protects both organizational assets and reputation long-term.
Interested in Patch Management services or need cybersecurity consultation? Contact KTNBS team - we're ready to provide guidance and design solutions tailored to your organization.
Share this article
Admin User
Content Author
Related Articles