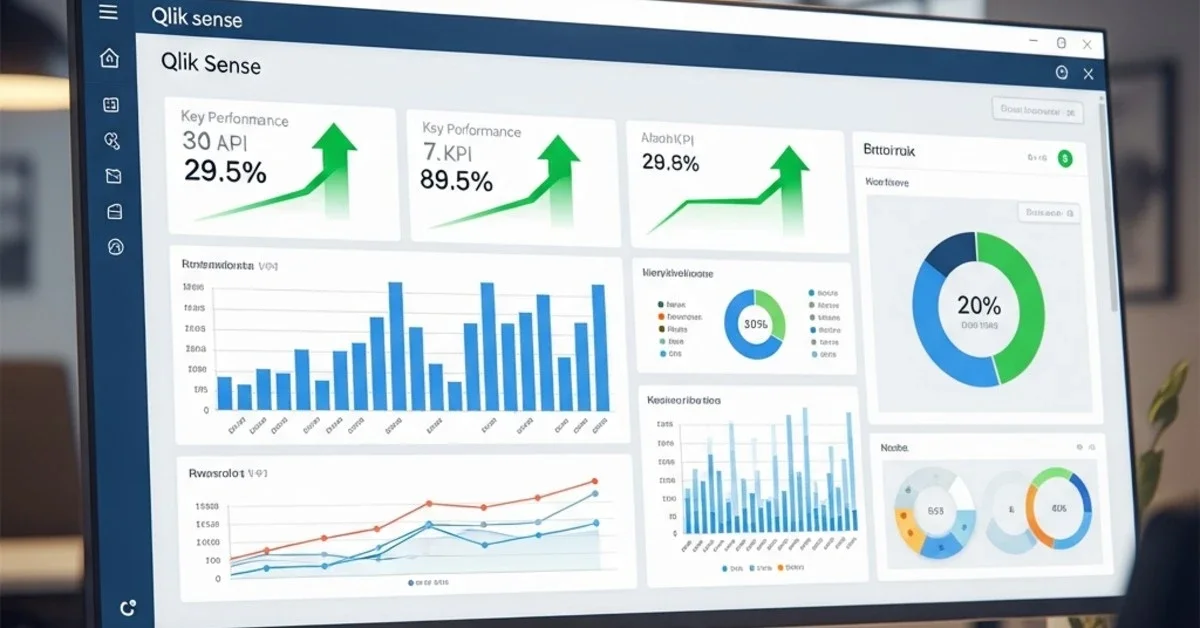
Qlik Sense: Turn Your Data into Sales with Business Intelligence
Why data is the most valuable asset of the modern business In the digital age every kind of business generates huge amounts of data every day. The key question is not "how much data do we have?" but "how much value do we get from the data we have?" Data that is analyzed correctly can become a business strategy that drives sales and significantly increases profit. Qlik Sense is a Business Intelligence (BI) platform that helps organizations turn raw data into insights they can use to make business decisions immediately, with self-service analytics and interactive visualization that everyone in the organization can use. The data management problems modern businesses face 1. Data scattered across many systems Sales data sits in the CRM, financial data in the ERP and customer data in the marketing platform, so you can't see the whole picture. Combining data from several sources takes a long time and is highly complex. 2. Reports that are slow and out of date A monthly report that arrives two weeks after the month ends can't help solve today's problems. Businesses need real-time data to make timely decisions. 3. Constant reliance on the IT team or data analysts Every time you need a new report or a different view of the data you must wait for the IT team to build it, which costs business opportunities and reduces agility. 4. A lack of deep understanding from the data You have only numbers and charts but don't know what to do. Without analysis of the relationships between data you miss the chance to find the business's strengths and weaknesses. 5. Excel can't keep up with complex data When data runs to millions of rows, Excel slows down, crashes often and can't create complex or interactive visualizations. There are also problems with version control and data security. Qlik Sense: the business intelligence platform that makes data easy to understand Qlik Sense is a modern analytics platform designed so that everyone in the organization can build their own data analysis and dashboards without advanced technical knowledge. It is powered by an AI analytics engine called the Associative Engine, which sets it apart from typical BI tools. What makes Qlik Sense different Associative Analytics Engine Unlike typical query-based BI, Qlik uses an Associative Engine that loads all data into memory and builds relationships between every piece of data, so you can explore your data freely without defining queries or drill paths in advance. Core Technology Self-Service Analytics Users can build their own analyses and visualizations without relying on the IT team, using an easy drag-and-drop interface. Smart Visualization AI recommends the most suitable visualization for each type of data, and Insight Advisor helps find insights hidden in the data. Cloud & On-Premise Available both in the cloud (SaaS) and installed on-premises, to meet security and data-control requirements. How Qlik Sense works: from raw data to decisions Connect data from every source Qlik Sense connects to more than 100 data sources, including: Databases: SQL Server, MySQL, Oracle, PostgreSQL Cloud Services: Salesforce, Google Analytics, AWS, Azure Files: Excel, CSV, JSON, XML, Parquet ERP/CRM: SAP, Microsoft Dynamics, Oracle EBS Big Data: Hadoop, Spark, MongoDB REST API: connect to any system that has an API Data connectors run automatically and can refresh data on a schedule you set Clean and prepare the data (data preparation) Use Data Manager and Data Load Editor to: Combine data from several sources (join, concatenate) Clean the data (remove duplicates, handle null values) Create calculated fields and transformations Define the data model and relationships Data profiling shows data quality and recommends improvements Build visualizations and dashboards Use drag-and-drop to build charts and dashboards: Charts: Bar, Line, Pie, Scatter, Combo Charts Tables: Pivot Tables, Straight Tables Maps: Geographic visualization with drill-down KPIs: Gauges, Bullet charts, Indicators Advanced: Waterfall, Funnel, Treemap, Heatmap Smart Search lets you search data in natural language, for example "sales for the last 3 months" Analyze and discover insights Qlik Insight Advisor uses AI to: Create suitable visualizations automatically Find patterns and anomalies in the data Recommend interesting insights Predict trends (predictive analytics) Associative selection lets you click any data point to see the relationships immediately Share and collaborate Share insights with your team and executives: Publish dashboards to other users Set up access control and security Create stories and presentations Export to PDF, Excel and PowerPoint Embed in web applications A mobile app to view data anywhere, anytime Set up alerts and automation Have the system notify you when something important happens: Data alerts: notify when data crosses a threshold you set Scheduled reports: send reports automatically on a schedule Triggered actions: make other systems run when a condition is met Key features that set Qlik Sense apart Associative Engine The most powerful analysis tool, with no limit on the direction in which you explore data. It shows everything related to what you select, displaying both related data (green) and unrelated data (gray), so you see the complete picture. AI-Powered Insights Insight Advisor uses machine learning to analyze data and recommend insights automatically, helping you find hidden trends, anomalies and business opportunities you might otherwise miss. Natural Language Processing Search data in natural language, for example "show this month's sales compared with last month", and the system builds a suitable visualization automatically. Augmented Analytics AI helps create and recommend visualizations that fit the nature of the data. AutoML builds predictive analytics models automatically. Responsive Design Dashboards adapt themselves to every device automatically, whether desktop, tablet or mobile, with native apps for iOS and Android. Real-time Data Analytics Connect to streaming data sources to analyze data in real time and see changes the moment they happen, with no waiting for a refresh. Collaboration Tools Share and collaborate on a single dashboard: add comments, annotations and bookmarks, and share insights by email, Slack or Teams. Enterprise-Grade Security Row-level and column-level security control who sees what data. Data is encrypted both at rest and in transit, with support for SSO, SAML and OAuth. Extensibility & API Qlik Sense APIs let developers build custom extensions, integrate with other systems and automate workflows. An extension framework supports custom visualizations. How Qlik Sense helps increase sales 1. Sales performance analysis All industries The problem: You don't know which salespeople are doing well, which products sell best or which customer groups have potential The solution: A dashboard shows real-time sales by salesperson, product and region Compare performance against targets and competitors Analyze the conversion funnel to find where customers drop off Predictive analytics forecast next month's sales The result: Sales up 15-25% by focusing on high-potential products and customers 2. Customer segmentation & behavior analysis Retail, E-commerce The problem: Each customer group behaves differently, but all of them get the same marketing The solution: Analyze purchase data with RFM analysis (recency, frequency, monetary) Divide customers into groups: VIP, regular, inactive, potential Analyze customer lifetime value (CLV) See cross-selling and up-selling opportunities Track customer churn and find the causes The result: Customer retention up 20-30% and repeat purchases up 40% 3. Inventory & supply chain optimization Manufacturing, Retail, Distribution The problem: Sometimes products run out and sometimes they sit in stock, losing sales and raising costs The solution: A dashboard shows real-time stock levels at every location Calculate safety stock and reorder points automatically ABC analysis to find the most important products Track slow-moving and dead stock Forecast demand with machine learning Analyze supplier performance The result: Inventory down 20-30% while service level rises to 95%+ 4. Financial analysis & profitability All industries The problem: You don't know which products, customers or channels are profitable The solution: Analyze gross margin and net margin by product, customer and channel Track cash flow and working capital Analyze the cost structure to find where costs can be cut Budget vs Actual Analysis Profitability analysis at SKU level The result: Profit up 10-20% by dropping loss-making products and focusing on profitable ones 5. Marketing campaign effectiveness Marketing, E-commerce The problem: You spend heavily on advertising but don't know which channels work The solution: Combine data from Google Analytics, Facebook Ads and email marketing Analyze the ROI of each marketing channel Track the customer journey from first touch to conversion Multi-touch attribution modeling A/B Testing Results Analysis The result: Marketing ROI up 30-50% by moving budget to the channels that are effective 6. Production & operations analytics Manufacturing The problem: You don't know how well the production line is performing or where the problems are The solution: A dashboard shows OEE (overall equipment effectiveness) Track downtime, cycle time and scrap rate Analyze the root causes of quality problems Capacity planning and resource utilization Predictive Maintenance The result: OEE up from 65% to 85% and scrap down 50% When should you choose Qlik Sense? ✅ You want every user to explore data freely without limits (true self-service) ✅ You want AI to help find insights automatically ✅ You have data from several complex sources and want to see the relationships ✅ You want flexibility in deployment (cloud or on-premises) ✅ You have non-technical users who want to analyze data themselves ✅ You want governed self-service (controlled, yet still free) Frequently asked questions (FAQ) How is Qlik Sense different from QlikView? QlikView is the earlier platform and focuses on guided analytics (designed by developers), while Qlik Sense is a modern BI platform that focuses on self-service analytics, with responsive design, cloud readiness and more modern AI/ML features. Qlik recommends that new customers use Qlik Sense. How much technical knowledge is needed to use it? End users can use dashboards and explore data with no technical knowledge at all, using drag-and-drop and clicks to filter data. Building a new dashboard needs a basic understanding of data and visualization but no coding. Data integration may need some SQL or scripting knowledge. Does Qlik Sense support big data? Yes. Qlik Sense can handle tens or hundreds of millions of rows using a high-performance in-memory engine. It can also connect directly to big data platforms such as Hadoop and Spark, and to cloud data warehouses such as Snowflake and AWS Redshift. What about data security? Qlik Sense has enterprise-grade security covering: data encryption (SSL/TLS), row-level and column-level security, single sign-on (SSO), multi-factor authentication, audit logging and compliance certifications (SOC 2, ISO 27001, GDPR), and you can define detailed access control over who sees which data. Can it integrate with our existing systems? Yes. Qlik Sense has more than 100 connectors, including ERP, CRM, databases, cloud services, Excel, web APIs and more. There is also a REST API and an extension framework for developers to build custom integrations. How long until we start to see results? You can see results from the first dashboard within 2-4 weeks. A full implementation may take 2-3 months depending on the complexity and the number of use cases, but we recommend an agile approach: start with an MVP and then expand. Is Thai-language support available? The Qlik Sense interface supports Thai, and there are partners in Thailand who can provide Thai-language support. KTN Business Solutions is a Qlik partner that can provide complete consultation, implementation and support in Thai. Good data becomes good decisions, and good decisions lead to good business results It's time to turn your data into a competitive advantage. Start with Qlik Sense today. Ready to turn data into sales?